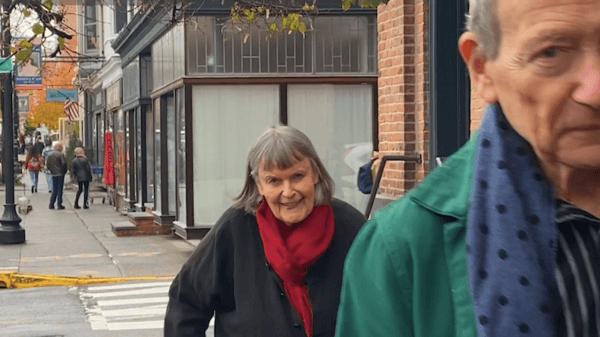
Democratic Mayoral candidate Jen White won every voting district in Nyack in the Sept 13 Democratic Primary except 15 and 20.
by Dave Zornow
Nyack, September 19 — Democratic voters in Nyack selected a mayoral candidate last week for the general election in November. But Tuesday’s vote also marked a passing of the torch from older Democrats to the next generation.
Trustee Jen White claimed the nomination ousting incumbent Mayor Richard Kavesh. White bested Kavesh 56-43 percent while taking six of eight voting districts in the village.
In a parallel survey run by NyackNewsAndViews on September 12-13, respondents who chose Jen White tended to be younger and have fewer years in the county compared to Kavesh supporters who were older and had deeper roots in Rockland. The NyackNewsAndViews poll included Republicans, Indepedents and residents of other river villages in addition to registered Democrats.
Almost 9 of 10 Kavesh supporters in the survey (86 percent) were between the ages of 35 and 64. By comparison, the majority of White supporters were 25-49. Kavesh supporters were 60 percent more likely to be 50+ than White respondents in the online poll.
These results were also reflected in the the number of years that respondents say they have lived in Rockland. More than 6 in 10 White supporters have lived in Rockland less than 20 years. Among Kavesh supporters, more than half (54 percent) say they have lived in the county for twenty years or more.
The survey also included a question about consolidating village governments into a single municipal entity. In response to the question “if taxes remained the same and village services increased or stayed the same, would you be in favor of consolidating the separate Nyack River Village governments into one unit?” there was a clear difference between Kavesh and White supporters. Almost 9 out of 10 White supporters said “yes, in principal, I would favor consolidation.” By comparison, almost 70 percent of Kavesh supporters said “No, I am opposed to local government consolidation.”
Sept 13, 2011 Democratic Primary Unofficial Results By Voting District
| Percent | Votes | |||||
| Kavesh | White | Kavesh | White | Write-in | Total | |
| Clarkstown 20 | 63% | 35% | 32 | 18 | 1 | 51 |
| Orangetown 2 | 47% | 51% | 73 | 78 | 3 | 154 |
| Orangetown 5 | 37% | 63% | 54 | 92 | 0 | 146 |
| Orangetown 7 | 32% | 67% | 27 | 56 | 1 | 84 |
| Orangetown 8 | 36% | 62% | 44 | 76 | 2 | 122 |
| Orangetown 15 | 62% | 38% | 42 | 26 | 0 | 68 |
| Orangetown 18 | 39% | 61% | 45 | 69 | 0 | 114 |
| Orangetown 46 | 42% | 57% | 42 | 57 | 1 | 100 |
| Total | 43% | 56% | 359 | 472 | 8 | 839 |
Source: Rockland County Board of Elections, Unofficial Election District Results


